The app step by step · Chapter 20
The graph
The Graph tab shows every space as a map. Folders are bubbles, notes are dots and links are lines. The closer you zoom in, the more bubbles open up.
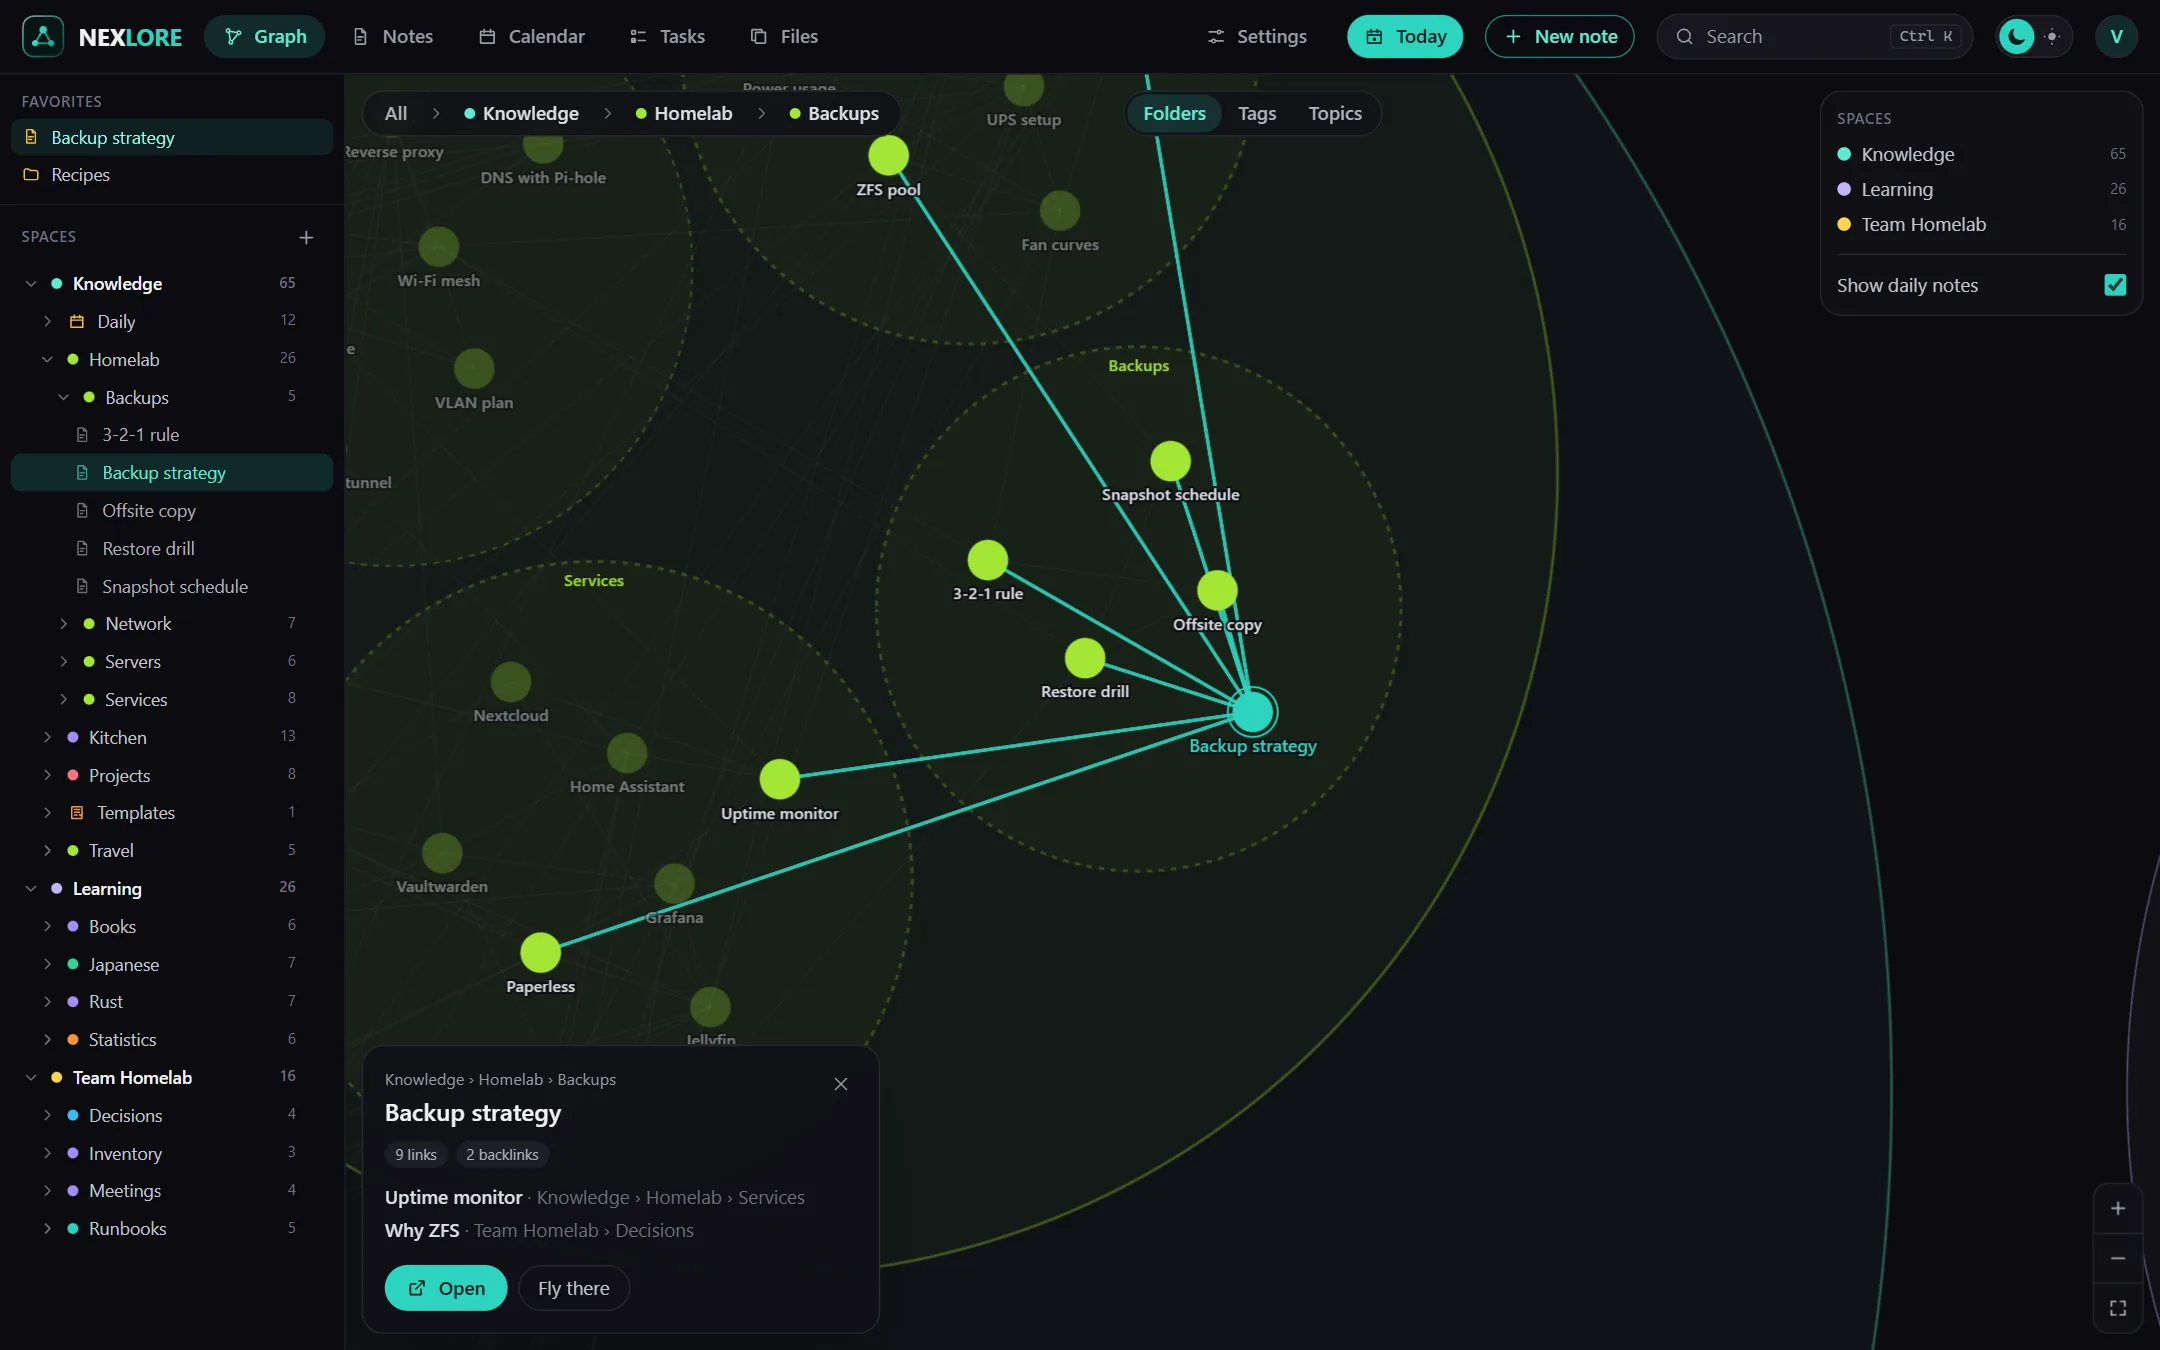
Finding your way around the map
| With | What happens |
|---|---|
| scrolling or two fingers | zoom, and a bubble opens once it's big enough |
| dragging | move the map |
| a click on a bubble | fly into it |
| a double click on a dot | open the note |
| arrow keys, + and -, 0 | move, zoom, show everything |
At the top left it says where you are, and a click on it takes you back. When you hover over a note, its links light up. If there are very many lines, nexlore shows only those of the note you're pointing at.
Sorting by folders, tags or topics
At the top centre you choose how the map groups your notes.
- Folders: The map shows the notes the way the files are stored. nexlore splits big folders without subfolders into smaller bubbles by their links and names them after the note that is linked most.
- Tags: Every note sits under its first tag, nested tags appear as a bubble in a bubble, and there's also a bubble “No tag”.
- Topics: nexlore groups the notes by their words, tags and links and names each group after three keywords. They are worked out again at night, and whoever manages a space can also start that right away.
Lore saysThe map stays calm. New notes slot in without the rest jumping around, and at night things are gently rearranged. You show or hide daily notes with a toggle, otherwise over time they would fill every map.
Smooth even with lots of notes
Your browser draws the graph with WebGL, and the server works out the layout and delivers it in tiles. That keeps the map smooth even with 100,000 notes. It doesn't show anything you may not read, not even a line leading there. On a phone, the switches sit behind a button in a sheet of their own.